Modern crypto intelligence, split for traders and builders.
Optiom brings together a graph terminal for trading decisions and an alternative data platform for API, CSV, research, and models.
Built for teams who need clean crypto data
By traders, for builders
Graphs when you trade. Raw data when you build.
- Standardized JSON / CSV
- Every crypto dataset is normalized across venues and available as API responses or flat CSV exports.
- HTTP examples
- Curl, fetch, and Python requests snippets for charts, research notebooks, alerts, and data pipelines.
- Built for backtests
- Historical candles, funding, liquidations, whale flows, sentiment, and venue-level metadata.
import requests

res = requests.get(
    "https://app.optiom.io/api/tradinghub/funding",
    params={"symbol": "BTCUSDT", "max_rows": 5000},
    timeout=15,
)
res.raise_for_status()

funding = res.json()
print(funding[:3])
1.2T+
Rows of data
50+
Venues indexed
99.9%
Pipeline uptime
CSV/API
Delivery modes
Two products, one platform
Choose how you consume Optiom.
Use the terminal visually, plug data into your application, or export alternative datasets straight to CSV.
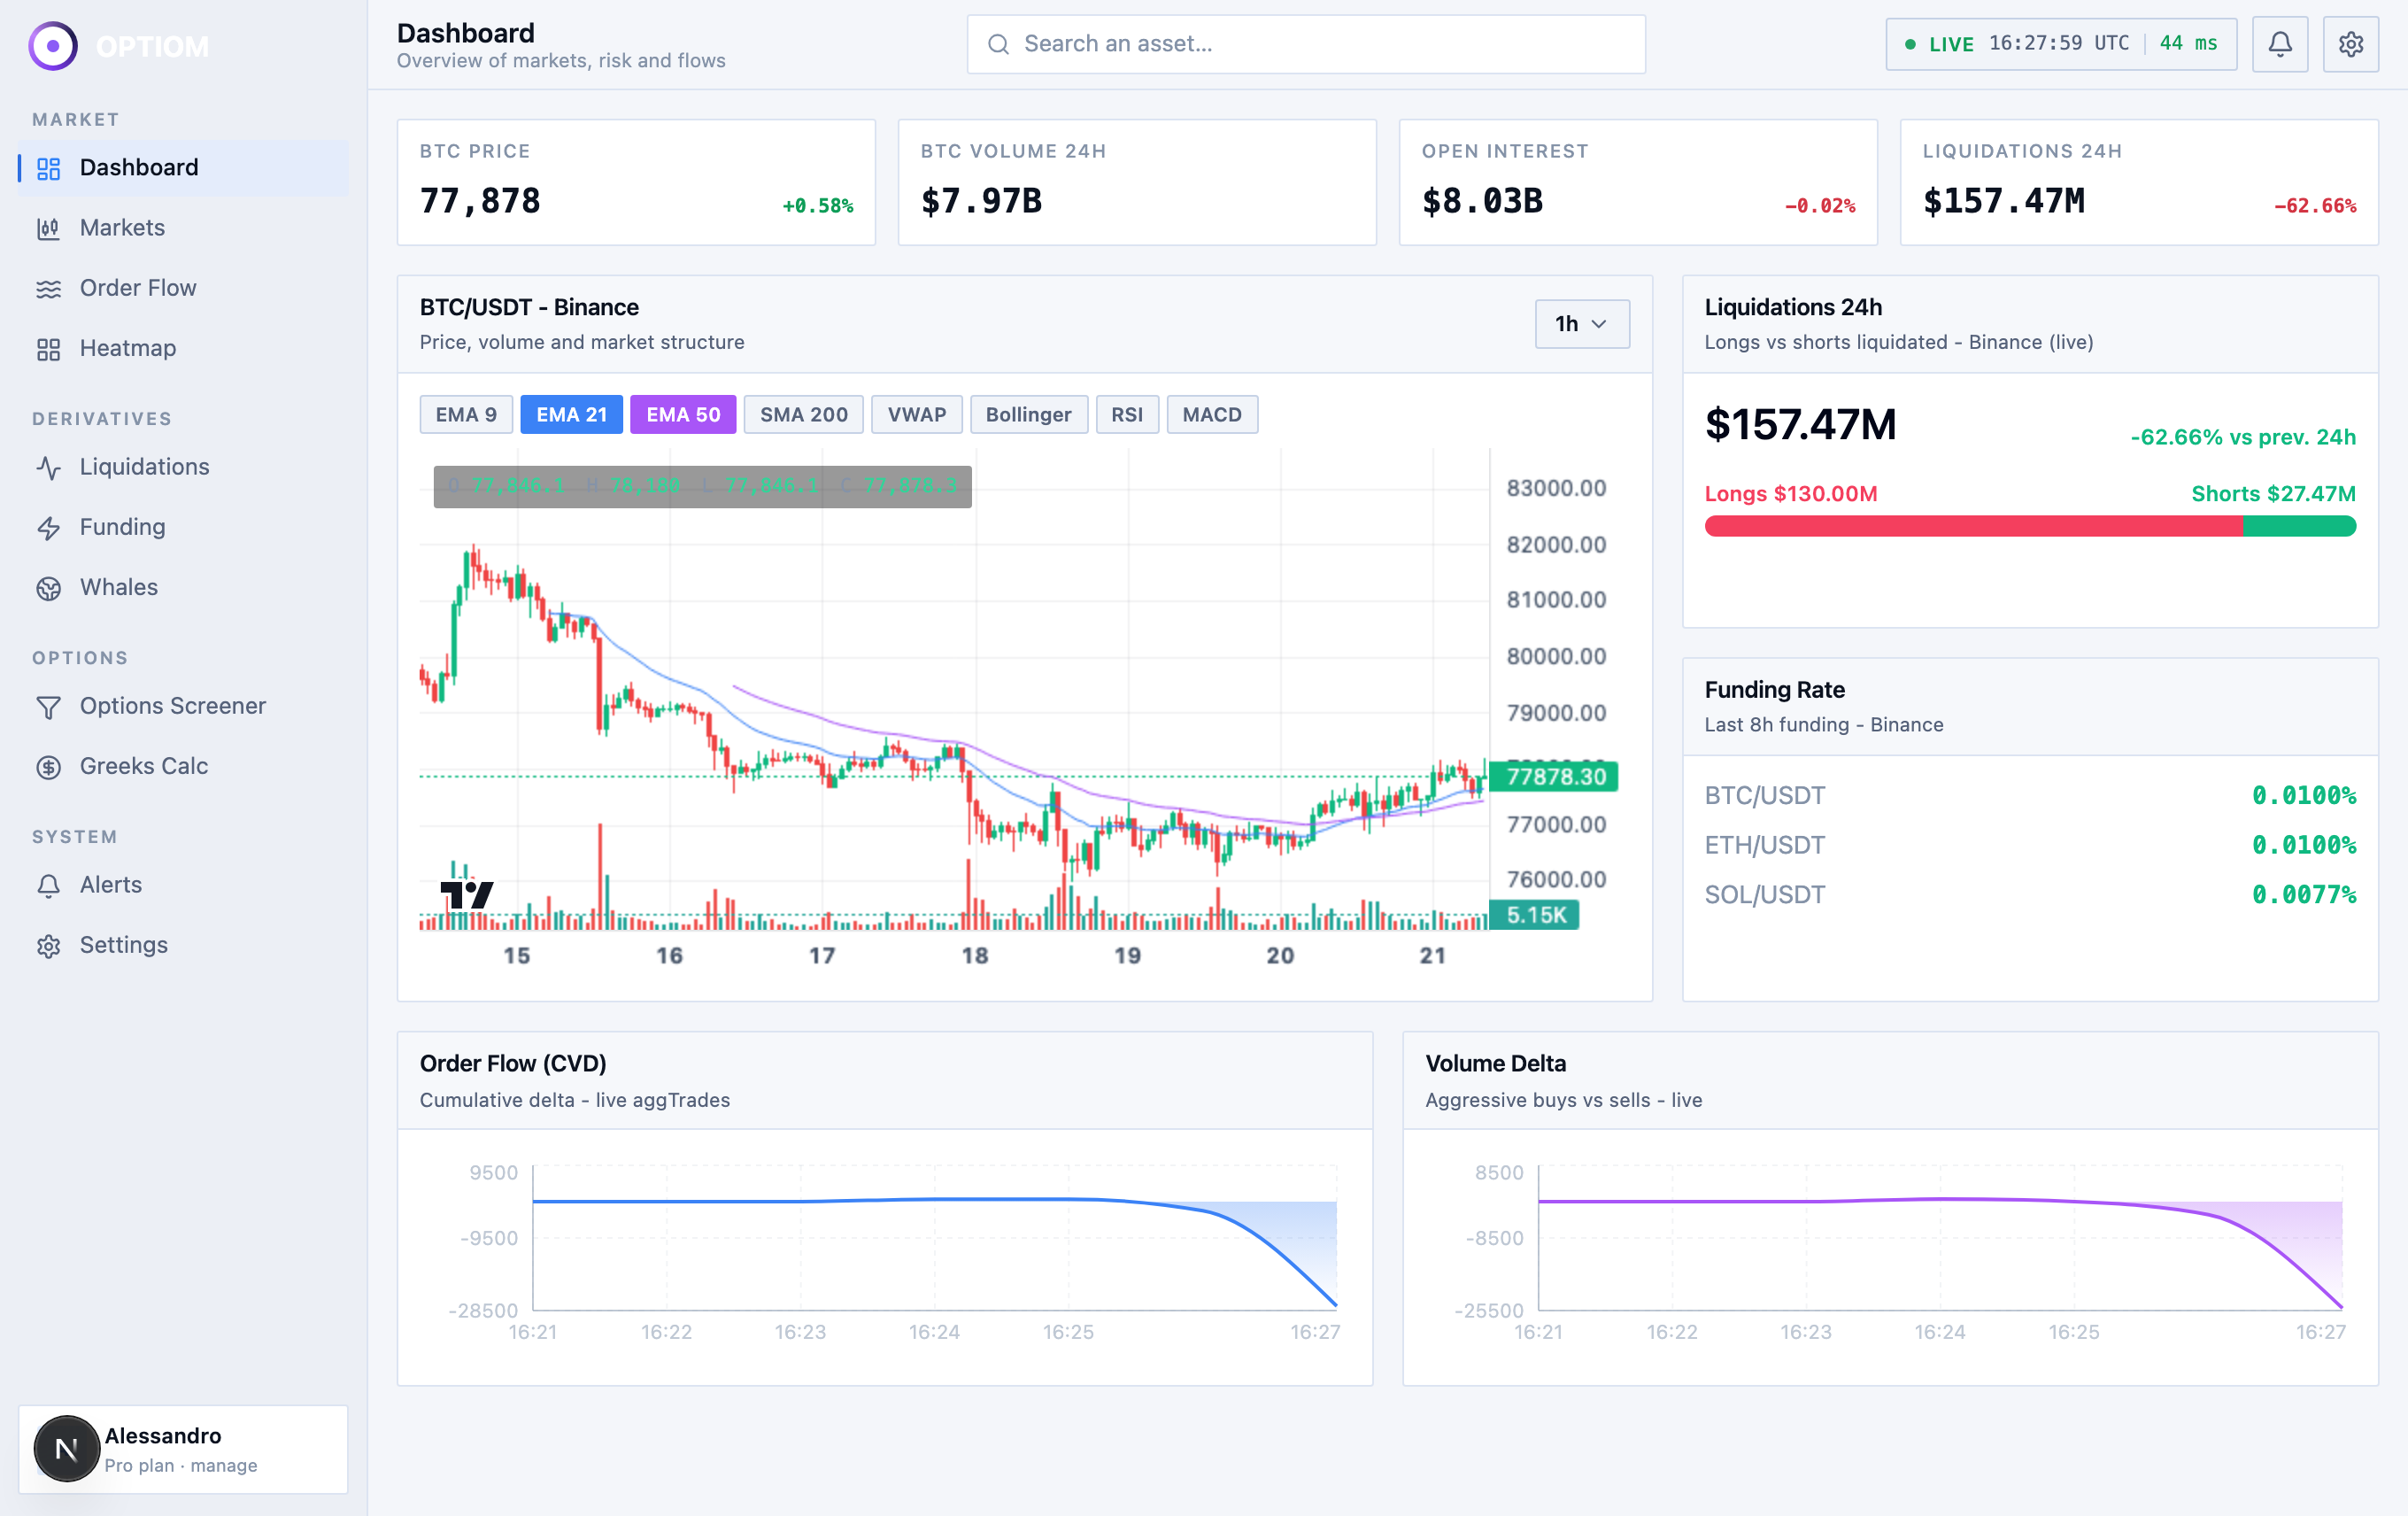
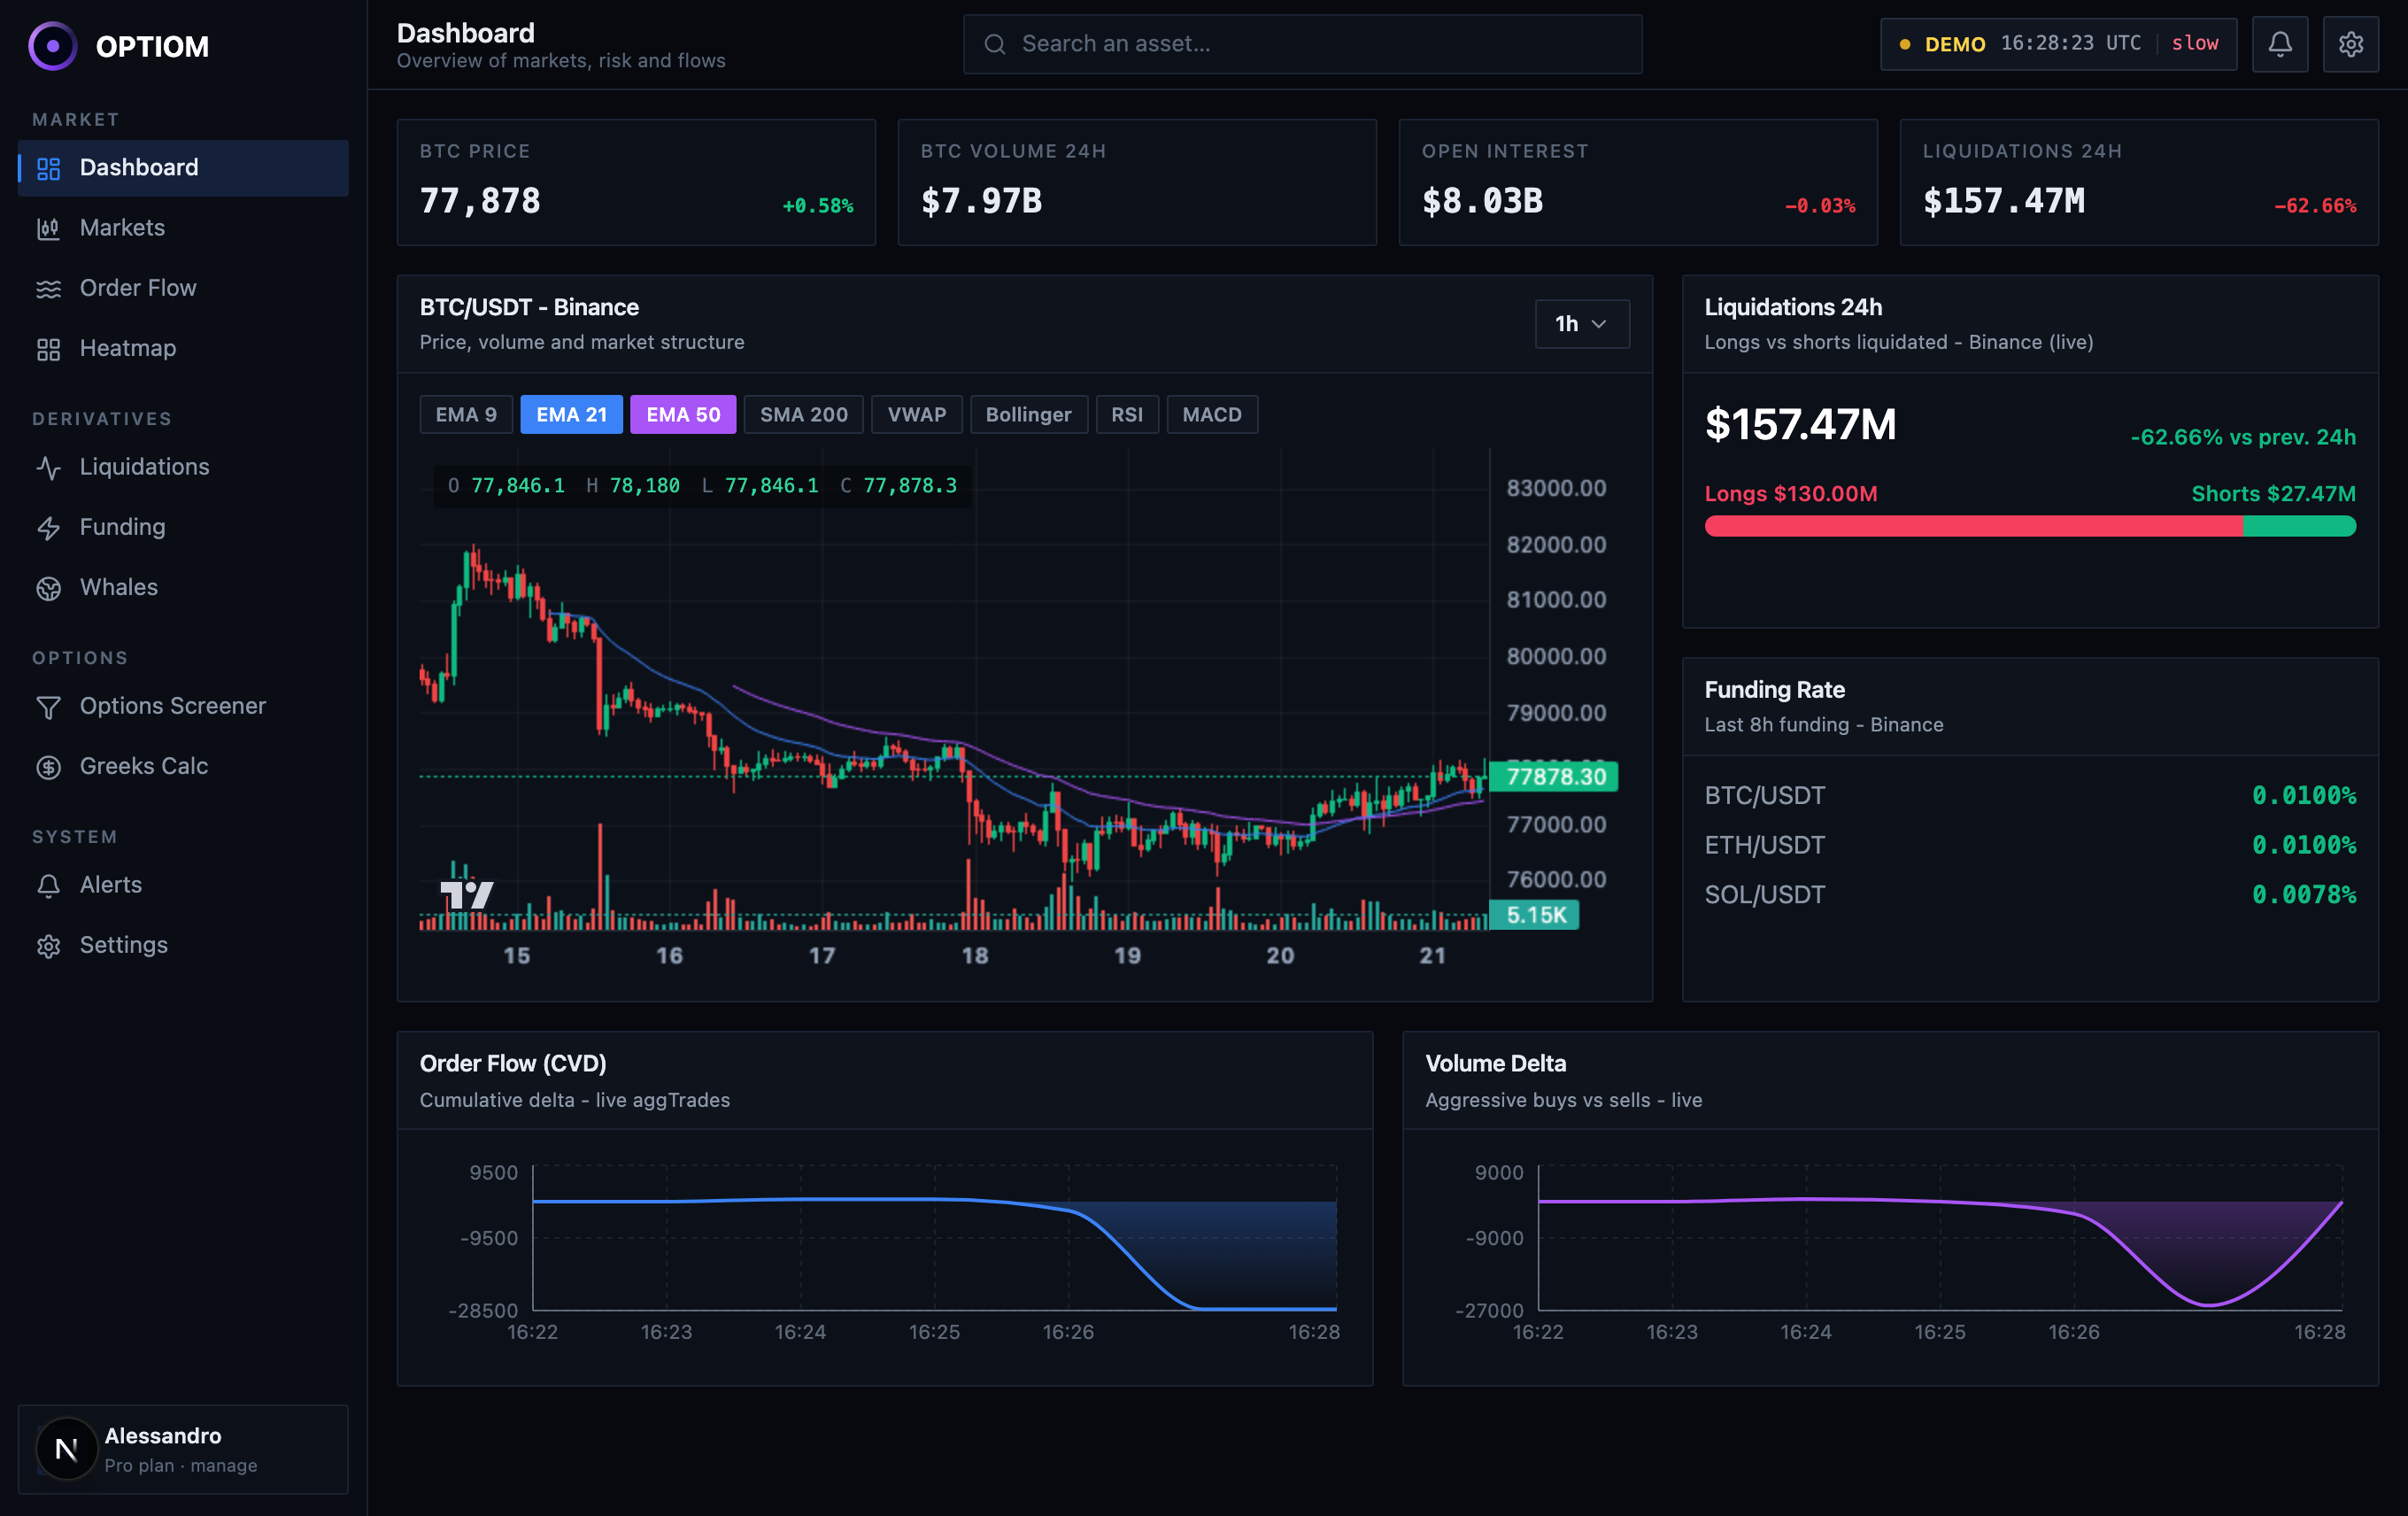
Graphs Terminal
Dashboards, candles, order flow, funding, liquidations, whales, and alerts for daily trading decisions.
Open terminalAlternative Data
Consumer-style crypto signals, on-chain flows, exchange microstructure, sentiment, and research-ready CSVs.
Explore datasetsAPI and CSV delivery
REST, WebSocket, CSV downloads, and scheduled exports for your app, models, or BI workflows.
View API docsMarket and alternative data for crypto
Unblock your next trading app, research model, or data product.
Direct from the pipeline
No spreadsheet chaos. Just clean crypto data.
Optiom normalizes exchange data, derived market metrics, and alternative signals so you can consume one schema across the whole workflow.
Collect
Exchange feeds, on-chain movement, social and sentiment
Normalize
One symbol map, venue ids, timestamps, and typed schemas
Deliver
Terminal, REST, WebSocket, CSV, scheduled exports
What will you build with Optiom?
Start visually in the terminal, then move the same signals into API calls, CSV exports, notebooks, and production systems.